The fight over which restaurant gets to satisfy your appetite is surely heating up. With ~$800B sales last year, this is an exciting space to watch, especially now. Customer expectations are at an all-time high and the consumer behavior is simply changing. Before we jump in, let’s look at what makes the restaurant business so unique.
Peculiarities of the Quick Service Restaurant Industry:
The average ticket value is low: Think about it this way, if you picked up all the bills from the last 10 times you visited a pizza chain and added it up, you probably won’t go beyond $1000. Juxtapose this with an apparel retailer and you would see that their average ticket value by itself is probably more than $1000.
Visit frequency is higher and cyclical: Compared to other retailers, the restaurant industry might see the same customers 8-10 times in a period of 6 months and before the frequency drops. Guest frequency is one of the most important metrics that a restaurant analytics tracks.
Size of the meal matters: Apart from guest frequency, the moolah is made by maximizing the size of the order. A large coke with the burger? Small fries to go with that? You can try combo 1 and get an extra burger by paying $2?
Customer tastes don’t vary much: Fashion trends may change with time, but a guy who likes pizzas, likes pizzas, for a long time. (Until he signs up for personal training at the local gym at least). A BBQ enthusiast might always order the same slow-cooked pork roast sandwich as opposed to a vegan who might order a vegan sandwich, at the very same outlet. And this taste does not change much over time.
The restaurant industry is unique for sure, but if you look closer, the mandates from their C level can be boiled down to three simple goals:
- Increase Meal Size
- Increase Guest Frequency
- Decrease Customer Lapsation
Gone are the days when oversized chicken costumes and cigarette smoking men, dressed as clowns were deployed as strategies to attain these goals. In today’s day and age, there are advanced tools, smarter analytics, and intelligible information that are helping restauranteurs devise effective strategies. With an increasingly digital-savvy customer, in a multichannel ordering environment, there is no dearth of data that is available for restaurants. The real trick is, however, to make sense of all these nuggets of information and derive insights that positively impact the Net Promoter Score (NPS).
Here are some examples of how some leading restaurant chains have put their data to work:
Identified Taste affinity clusters – A large pizza chain recently used millions of data points to arrive at 10 primary segments of customers and looked at their past purchase behavior to identify taste preferences. They identified that the large pizzas were primarily ordered by dine-in, family segment as opposed to the regular size pizzas which were typically ordered by office goers/ singles who visited the store. They even identified the times at which a certain pizza gets sold more and identified cross-sell items based on purchase behavior/ taste of a segment.
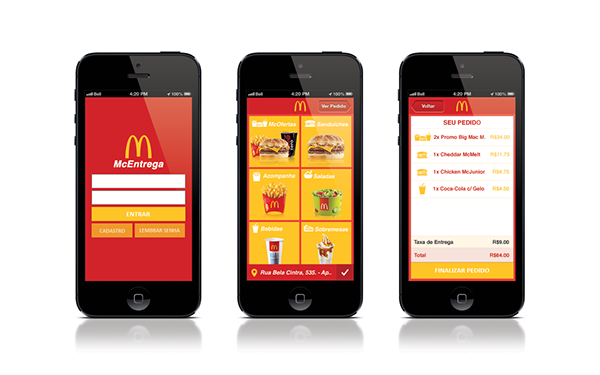
Buying behavior analysis– A burger chain took a different approach. They looked at purchase behavior across different channels to identify which menu items can be added to the combo for someone who orders through a mobile device as opposed to someone who prefers to visit the restaurant. They even used advanced analytics to get a single view of the customer by integrating their POS, mobile, web and social data to identify the customer and ensured that their messaging was consistent across all channels.
NPS and Feedback Analysis – A Chinese food chain used advanced analytics to integrate all the channels that they received feedback in (mobile, at location, social) to get a single view of the customer and layered it up with sentiment analysis. They used this data to give each customer a lapsation score which was then used to target them with unique offers depending on their lifecycle.
Store location analysis – Restaurant predictive analytics models were used by a coffee chain to identify the probability of a new store succeeding in a specific location as opposed to a location down the street. They identified pockets of demand and the model prescribed a set of potential locations in a given geographic area. They then used this data to score and rank comparable locations to determine the best location and format for the new store.
With the onset of advanced analytics in restaurant industry, the real question now is: As a customer, do they know what you are going to eat before you do?