
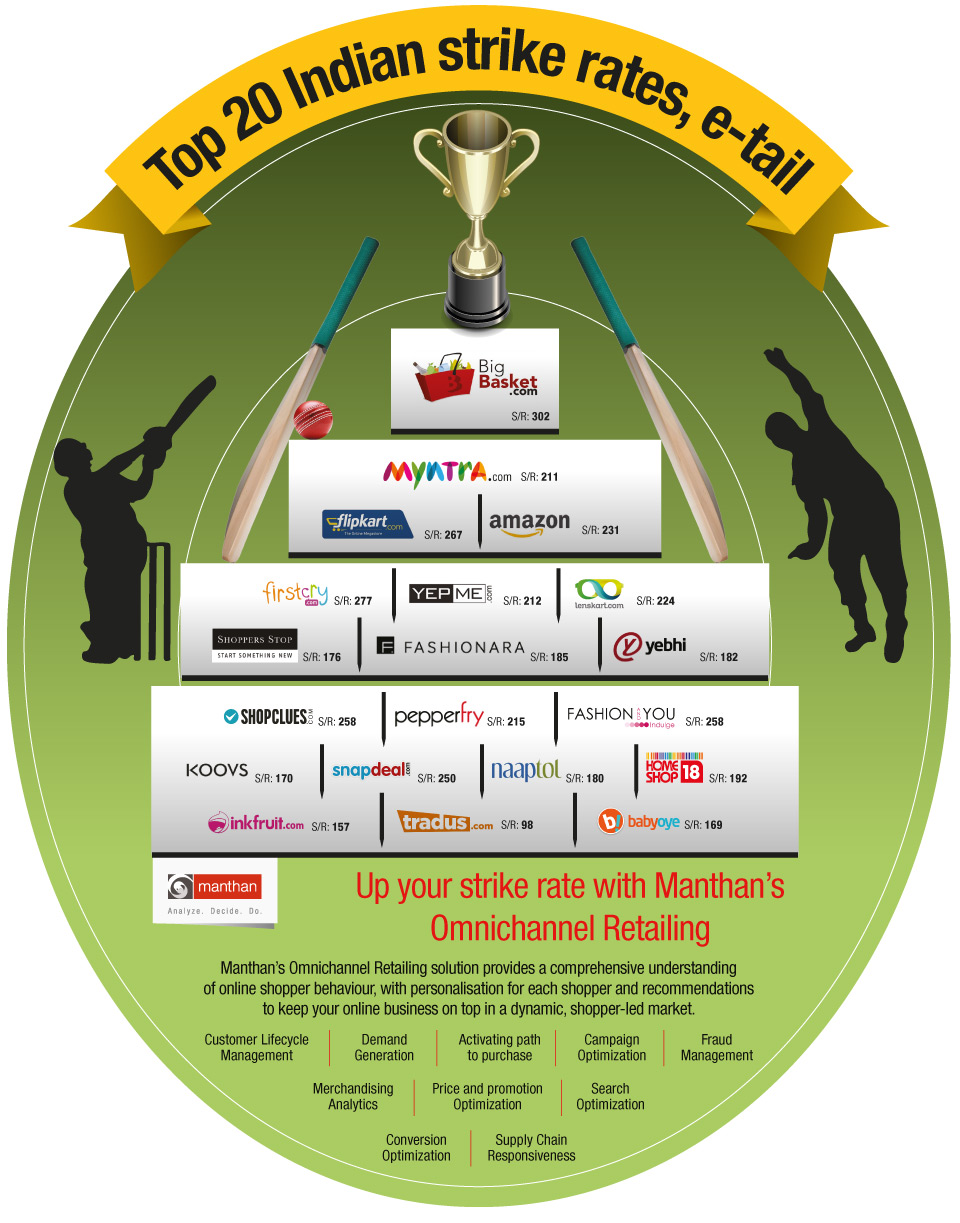
Top 20 Indian strike rates, e-tail
A comparative analysis of demand conversion in e-Commerce
Objective:
As part of Manthan’s demand conversion services we help clients measure, analyze, identify and execute strategies to increase demand conversion. The measurement typically starts with attribution of site engagement metrics to conversion, and then improving relevant engagement metrics. The analysis presented here is at an aggregate level, considering the top 20 e-Commerce retailers in India.
Manthan’s goal was to measure and rank the Indian e-Commerce retailers on the level of engagement on their website. Several metrics like bounce rate, conversion rate, time on site, page views etc. can be used to measure site engagement effectiveness. We also wanted to call out the influence of site engagement on conversion.
Challenges:
Typically, when we conduct this study for our clients, we have richer data and we can include other interesting metrics like navigation depth, cart abandonment, browse/search abandonment etc. to better measure the engagement.
Ideally, we would use conversion rate to measure the conversion effectiveness. However, conversion rate was not publicly available for all the companies in the list. Hence, we had to develop a proxy for conversion rate.
Solution:
The engagement metrics we used were time on site, page views per visit and bounce rate. To overcome the absence of conversion rate we devised an alternate metric, sale per visit, as a proxy for measuring the conversion effectiveness. We recognize this may be biased by the product category which influences the sales amount. Also, some categories have more visits per transaction as compared with others. However the metrics available were sufficient proxy to attribute engagement to conversion effectiveness
Results:
We found that the customers average 5.6 page views per visit and spend about 339 seconds on a site per visit. Our research shows that, contrary to popular belief the sales is likely to go down as the customer spends more time on the site. In fact the sale is likely to reduce by Rs. 0.38 for every additional second the customer spends on the site. Conversely, sales increases with the increase in number of page views per visit. Every additional page view is likely to increase the sales per visit by INR 0.43. The surprising outlier was Inkfruit who had the highest sales per visit with about 55 seconds for every page view.
| Company Name | Annual Revenue | Estimated Visits | Time on Site | Avg. Page Views (Dec) | Bounce Rate | Strike Rate | Overall Score | Overall Rank |
| Bigbasket | $10 million | 1.35M | 9:50 | 11.39 | 0.22 | 302.49 | 1.11 | 1 |
| Myntra | $80million | 41.12M | 6:32 | 5.74 | 0.24 | 210.50 | 2.06 | 2 |
| Flipkart | $2billion | 115M | 8:28 | 7.58 | 0.26 | 266.98 | 3.09 | 3 |
| Amazon.in | $1 billion | 69.6M | 6:59 | 7.1 | 0.32 | 231.36 | 4.07 | 4 |
| FirstCry | $18 million | 2.9M | 8:34 | 8.24 | 0.33 | 276.90 | 5.09 | 5 |
| Yepme | $65 million | 4.2M | 6:16 | 5.13 | 0.33 | 211.66 | 6.04 | 6 |
| Lenskart | $80million | 2.65M | 6:40 | 6.25 | 0.34 | 223.91 | 7.05 | 7 |
| shopperstop.com | $1 Million | 1.15M | 4:59 | 5.6 | 0.34 | 176.11 | 8.01 | 8 |
| Fashionara | $10 Million | 1.95M | 5:17 | 5.48 | 0.35 | 184.97 | 9.01 | 9 |
| Yebhi | $5 million | 680K | 5:10 | 4.29 | 0.35 | 181.80 | 10.00 | 10 |
| Shopclues | $60 million | 15.6M | 7:50 | 6.41 | 0.35 | 258.27 | 11.05 | 11 |
| Pepperfry | $15 Million | 3.2M | 6:17 | 6.26 | 0.36 | 214.78 | 12.02 | 12 |
| Fashionandyou | $60million | 5.2M | 7:45 | 6.17 | 0.38 | 258.29 | 13.03 | 13 |
| Koovs | $1 Million | 1.65M | 4:39 | 7.05 | 0.38 | 170.08 | 13.97 | 14 |
| Snapdeal | $100 million | 69.8M | 7:26 | 5.3 | 0.38 | 249.82 | 15.02 | 15 |
| Naaptol | $100 million | 3M | 4:56 | 4.91 | 0.40 | 180.42 | 15.97 | 16 |
| Homeshop18 | $75million | 6M | 5:20 | 5.53 | 0.41 | 192.47 | 16.98 | 17 |
| Inkfruit | $20 Million | 130K | 4:02 | 4.41 | 0.42 | 156.78 | 17.94 | 18 |
| Tradus | $20million | 170K | 1:57 | 2.61 | 0.43 | 98.43 | 18.91 | 19 |
| Baby Oye | $25 million | 490K | 4:23 | 4.74 | 0.44 | 168.60 | 19.94 | 20 |
Bigbasket
Myntra
Flipkart
Amazon.in
FirstCry
FirstCry
Lenskart
shopperstop.com
Fashionara
Yebhi
Shopclues
Pepperfry
Fashionandyou
Koovs
Snapdeal
Naaptol
Homeshop18
Inkfruit
Tradus
Baby Oye
*data sourced from the public domain
Disclaimer : Given that these observations are at an aggregate level and based on proxy metrics, it is best advised for each e-tailer to conduct the analysis on their own data at a visit granularity to understand the impact of engagement on conversion.